ObjectRays
-
class
raytracing.ObjectRays(diameter, halfAngle=1.0, H=3, T=3, rayColors=None, color=None, label=None)¶ Bases:
raytracing.rays.UniformRaysA set of rays used for objects.
Parameters: diameter (float) – Diameter of the object.
Other Parameters: - H (int) – The number of point sources to create on the object (the number of ray fans) across its diameter.
- T (int) – The number of rays to trace for each point source (ray fan) across halfAngle.
- halfAngle (float) – The half angle of each ray fan.
- rayColors – Specify a color or a set of colors for the traced rays.
- color – Color used to draw the graphics of the object (filled) and its images (outlined). By default, objects are blue and images are red, but this parameter overwrites both at the same time to help distinguish multiple objects in a path.
- label (str) – Label to display over the object in the imaging path.
-
append(ray)¶ A ray can be appended to the List of the rays using this function.
Parameters: ray (object of ray class) – a ray with height y and angle theta
-
count¶ Returns the number of rays in the list.
-
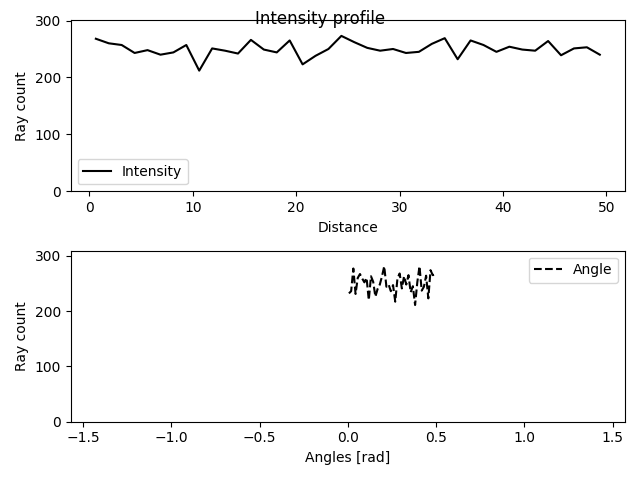
display(title='Intensity profile', showTheta=True)¶ This function plots the intensity profiles of a list of rays.
Parameters: - title (string) – the title for the plot (default=”Intensity profile”)
- showTheta (bool) – If True, the values for the angle of rays will be shown. (default=True)
Examples
>>> from raytracing import *
>>> nRays = 10000 # Increase for better resolution
>>> minHeight=0
>>> maxHeight=50
>>> minTheta=0
>>> maxTheta=0.5
>>> nBin=20
>>> # define a list of random rays with uniform distribution
>>> inputRays = RandomUniformRays(yMin=minHeight, yMax=maxHeight, thetaMin=minTheta,thetaMax=maxTheta, maxCount=nRays)
>>> inputRays.display()
-
displayProgress()¶ This function prints the progress of the iterations
-
load(filePath, append=False)¶ A list of rays can be loaded using this function.
Parameters: - filePath (str or PathLike or file-like object) – A path, or a Python file-like object, or possibly some backend-dependent object. Must be provided in OS-dependent format.
- append (bool) – If True, the loaded rays will be appended to the current list of rays.
-
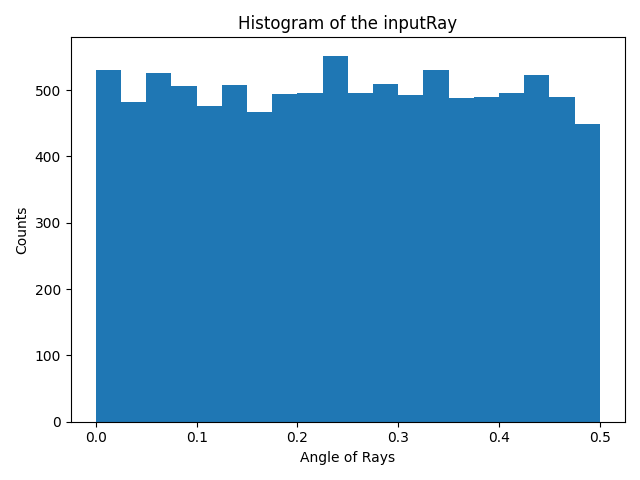
rayAnglesHistogram(binCount=None, minValue=None, maxValue=None)¶ This functions calculates the histogram for the angle of the rays.
Parameters: - binCount (int) – number of defined bins in the histogram. If it is not defined, the histogram will have 40 bins.
- minValue (float) – The minimum value to be considered in the histogram. If it is not defined in the inputs, the minimum angle of rays will be assigned to this parameter.
- maxValue (float) – The maximum value to be considered in the histogram. If it is not defined in the inputs, the maximum angle of rays will be assigned to this parameter.
Returns: - _xValuesAnglesHistogram (array) – An array (Bins*1) that includes the x values for bins.
- _thetaHistogram (array) – An array (Bins*1) that includes the y values for bins.
Examples
The function can be used to calculate the x values and y values for the histogram of an input ray.
>>> from raytracing import *
>>> nRays = 10000 # Increase for better resolution
>>> minHeight=0
>>> maxHeight=50
>>> minTheta=0
>>> maxTheta=0.5
>>> nBin=20
>>> # define a list of random rays with uniform distribution
>>> inputRays = RandomUniformRays(yMin=minHeight, yMax=maxHeight, thetaMin=minTheta,thetaMax=maxTheta, maxCount=nRays)
>>> [xVal,yVal]=inputRays.rayAnglesHistogram(binCount=nBin)
And to plot the hitogram we can use xVal and yVal of the theta as the following:
>>> import matplotlib.pyplot as plt
>>> plt.figure()
>>> plt.bar(xVal,yVal,width=maxTheta/nBin)
>>> plt.title('Histogram of the inputRay')
>>> plt.ylabel('Counts')
>>> plt.xlabel('Angle of Rays')
>>> plt.show()
See also
raytracing.rays.rayCountHistogram()
-
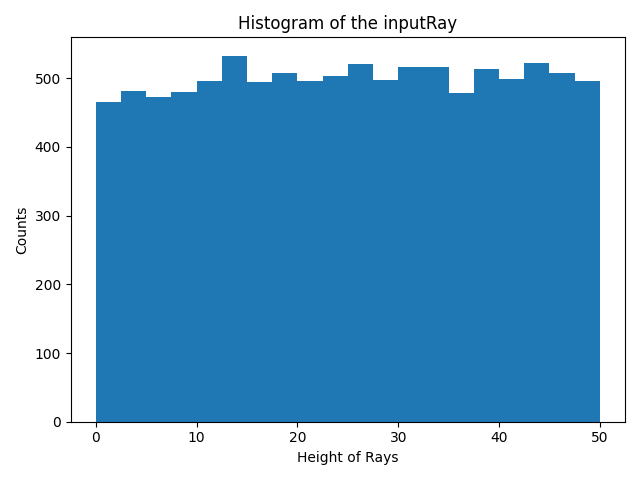
rayCountHistogram(binCount=None, minValue=None, maxValue=None)¶ This functions calculates the histogram for the height of the rays.
Parameters: - binCount (int) – number of defined bins in the histogram. If it is not defined, the histogram will have 40 bins.
- minValue (float) – The minimum value to be considered in the histogram. If it is not defined in the inputs, the minimum height of rays will be assigned to this parameter.
- maxValue (float) – The maximum value to be considered in the histogram. If it is not defined in the inputs, the maximum height of rays will be assigned to this parameter.
Returns: - _xValuesCountHistogram (array) – An array (Bins*1) that includes the x values for bins.
- _yHistogram (array) – An array (Bins*1) that includes the y values for bins.
Examples
The function can be used to calculate the x values and y values for the histogram of an input ray.
>>> from raytracing import *
>>> nRays = 10000 # Increase for better resolution
>>> minHeight=0
>>> maxHeight=50
>>> nBin=20
>>> inputRays = RandomUniformRays(yMin=minHeight,yMax=maxHeight, maxCount=nRays)
>>> [xVal,yVal]=inputRays.rayCountHistogram(binCount=nBin)
And to plot the hitogram we can use xVal and yVal as the following:
>>> import matplotlib.pyplot as plt
>>> plt.figure()
>>> plt.bar(xVal,yVal,width=maxHeight/nBin)
>>> plt.title('Histogram of the inputRay')
>>> plt.ylabel('Counts')
>>> plt.xlabel('Height of Rays')
>>> plt.show()
See also
raytracing.rays.rayAnglesHistogram()
-
save(filePath)¶ A list of rays can be saved using this function.
Parameters: filePath (str or PathLike or file-like object) – A path, or a Python file-like object, or possibly some backend-dependent object. Must be provided in OS-dependent format.
-
thetaValues¶ Returns the angles of rays in the list.
-
yValues¶ Returns the heights of rays in the list.
Methods
__init__(diameter[, halfAngle, H, T, …]) |
Initialize self. |
Inherited Methods
append(ray) |
A ray can be appended to the List of the rays using this function. |
display([title, showTheta]) |
This function plots the intensity profiles of a list of rays. |
displayProgress() |
This function prints the progress of the iterations |
load(filePath[, append]) |
A list of rays can be loaded using this function. |
rayAnglesHistogram([binCount, minValue, …]) |
This functions calculates the histogram for the angle of the rays. |
rayCountHistogram([binCount, minValue, maxValue]) |
This functions calculates the histogram for the height of the rays. |
save(filePath) |
A list of rays can be saved using this function. |
Attributes
count |
Returns the number of rays in the list. |
rays |
|
thetaValues |
Returns the angles of rays in the list. |
yValues |
Returns the heights of rays in the list. |