LambertianRays
-
class
raytracing.LambertianRays(yMax=1.0, yMin=None, M=100, N=100, I=100)¶ Bases:
raytracing.rays.RaysA list of rays with Lambertian distribution.
Parameters: - yMax (float) – Maximum height for the rays (default=1.0)
- yMin (float) – Minimum height for the rays (default=None). If no value is assigned to this parameter it will be -yMax.
- M (int) – Number of points that are defined for the height of rays
- N (int) – Number of rays for each point
- I (int) – Number of points that are defined for the angle of rays
Examples
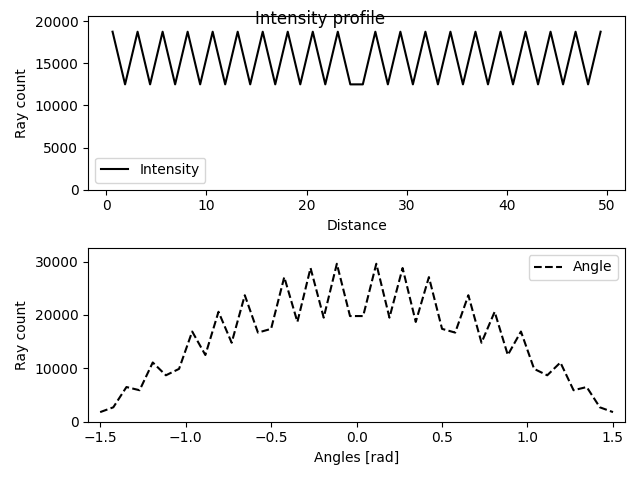
>>> from raytracing import *
>>> nRays = 1000 # Increase for better resolution
>>> minHeight=0
>>> maxHeight=50
>>> # define a list of rays with Lambertian distribution
>>> inputRays = LambertianRays(yMin=minHeight, yMax=maxHeight)
>>> inputRays.display()
-
append(ray)¶ A ray can be appended to the List of the rays using this function.
Parameters: ray (object of ray class) – a ray with height y and angle theta
-
count¶ Returns the number of rays in the list.
-
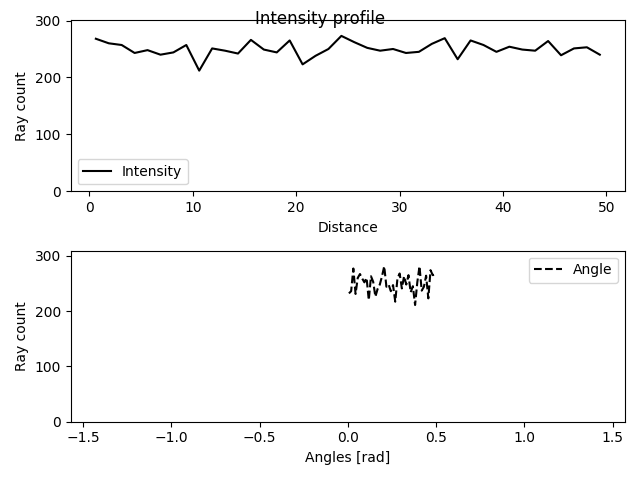
display(title='Intensity profile', showTheta=True)¶ This function plots the intensity profiles of a list of rays.
Parameters: - title (string) – the title for the plot (default=”Intensity profile”)
- showTheta (bool) – If True, the values for the angle of rays will be shown. (default=True)
Examples
>>> from raytracing import *
>>> nRays = 10000 # Increase for better resolution
>>> minHeight=0
>>> maxHeight=50
>>> minTheta=0
>>> maxTheta=0.5
>>> nBin=20
>>> # define a list of random rays with uniform distribution
>>> inputRays = RandomUniformRays(yMin=minHeight, yMax=maxHeight, thetaMin=minTheta,thetaMax=maxTheta, maxCount=nRays)
>>> inputRays.display()
-
displayProgress()¶ This function prints the progress of the iterations
-
load(filePath, append=False)¶ A list of rays can be loaded using this function.
Parameters: - filePath (str or PathLike or file-like object) – A path, or a Python file-like object, or possibly some backend-dependent object. Must be provided in OS-dependent format.
- append (bool) – If True, the loaded rays will be appended to the current list of rays.
-
rayAnglesHistogram(binCount=None, minValue=None, maxValue=None)¶ This functions calculates the histogram for the angle of the rays.
Parameters: - binCount (int) – number of defined bins in the histogram. If it is not defined, the histogram will have 40 bins.
- minValue (float) – The minimum value to be considered in the histogram. If it is not defined in the inputs, the minimum angle of rays will be assigned to this parameter.
- maxValue (float) – The maximum value to be considered in the histogram. If it is not defined in the inputs, the maximum angle of rays will be assigned to this parameter.
Returns: - _xValuesAnglesHistogram (array) – An array (Bins*1) that includes the x values for bins.
- _thetaHistogram (array) – An array (Bins*1) that includes the y values for bins.
Examples
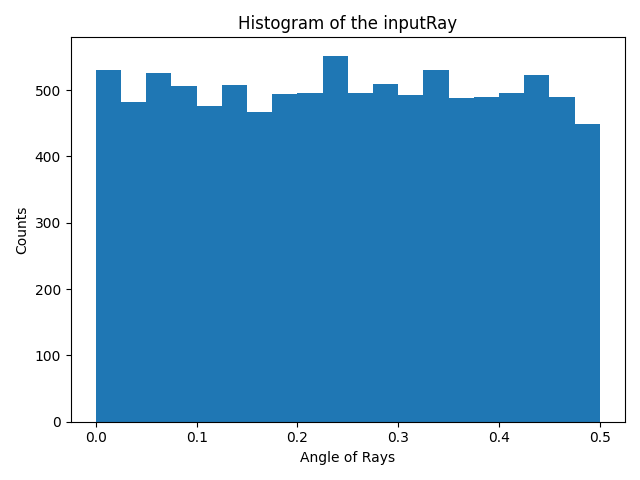
The function can be used to calculate the x values and y values for the histogram of an input ray.
>>> from raytracing import *
>>> nRays = 10000 # Increase for better resolution
>>> minHeight=0
>>> maxHeight=50
>>> minTheta=0
>>> maxTheta=0.5
>>> nBin=20
>>> # define a list of random rays with uniform distribution
>>> inputRays = RandomUniformRays(yMin=minHeight, yMax=maxHeight, thetaMin=minTheta,thetaMax=maxTheta, maxCount=nRays)
>>> [xVal,yVal]=inputRays.rayAnglesHistogram(binCount=nBin)
And to plot the hitogram we can use xVal and yVal of the theta as the following:
>>> import matplotlib.pyplot as plt
>>> plt.figure()
>>> plt.bar(xVal,yVal,width=maxTheta/nBin)
>>> plt.title('Histogram of the inputRay')
>>> plt.ylabel('Counts')
>>> plt.xlabel('Angle of Rays')
>>> plt.show()
See also
raytracing.rays.rayCountHistogram()
-
rayCountHistogram(binCount=None, minValue=None, maxValue=None)¶ This functions calculates the histogram for the height of the rays.
Parameters: - binCount (int) – number of defined bins in the histogram. If it is not defined, the histogram will have 40 bins.
- minValue (float) – The minimum value to be considered in the histogram. If it is not defined in the inputs, the minimum height of rays will be assigned to this parameter.
- maxValue (float) – The maximum value to be considered in the histogram. If it is not defined in the inputs, the maximum height of rays will be assigned to this parameter.
Returns: - _xValuesCountHistogram (array) – An array (Bins*1) that includes the x values for bins.
- _yHistogram (array) – An array (Bins*1) that includes the y values for bins.
Examples
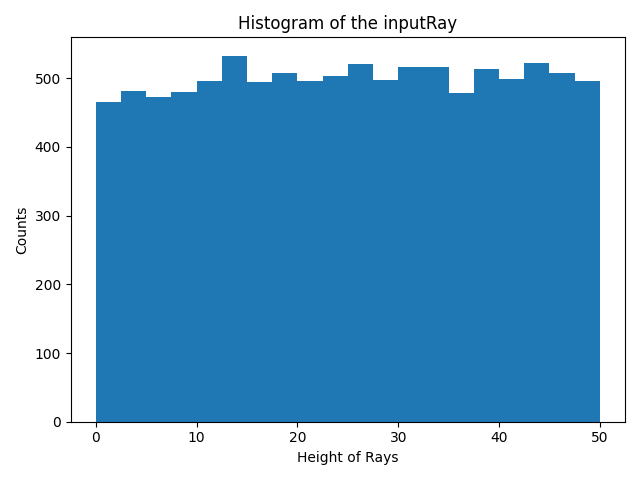
The function can be used to calculate the x values and y values for the histogram of an input ray.
>>> from raytracing import *
>>> nRays = 10000 # Increase for better resolution
>>> minHeight=0
>>> maxHeight=50
>>> nBin=20
>>> inputRays = RandomUniformRays(yMin=minHeight,yMax=maxHeight, maxCount=nRays)
>>> [xVal,yVal]=inputRays.rayCountHistogram(binCount=nBin)
And to plot the hitogram we can use xVal and yVal as the following:
>>> import matplotlib.pyplot as plt
>>> plt.figure()
>>> plt.bar(xVal,yVal,width=maxHeight/nBin)
>>> plt.title('Histogram of the inputRay')
>>> plt.ylabel('Counts')
>>> plt.xlabel('Height of Rays')
>>> plt.show()
See also
raytracing.rays.rayAnglesHistogram()
-
save(filePath)¶ A list of rays can be saved using this function.
Parameters: filePath (str or PathLike or file-like object) – A path, or a Python file-like object, or possibly some backend-dependent object. Must be provided in OS-dependent format.
-
thetaValues¶ Returns the angles of rays in the list.
-
yValues¶ Returns the heights of rays in the list.
Methods
__init__([yMax, yMin, M, N, I]) |
Initialize self. |
Inherited Methods
append(ray) |
A ray can be appended to the List of the rays using this function. |
display([title, showTheta]) |
This function plots the intensity profiles of a list of rays. |
displayProgress() |
This function prints the progress of the iterations |
load(filePath[, append]) |
A list of rays can be loaded using this function. |
rayAnglesHistogram([binCount, minValue, …]) |
This functions calculates the histogram for the angle of the rays. |
rayCountHistogram([binCount, minValue, maxValue]) |
This functions calculates the histogram for the height of the rays. |
save(filePath) |
A list of rays can be saved using this function. |
Attributes
count |
Returns the number of rays in the list. |
rays |
|
thetaValues |
Returns the angles of rays in the list. |
yValues |
Returns the heights of rays in the list. |