Rays
- class raytracing.Rays(rays=None)
Bases:
objectA source or a detector of rays
We can obtain intensity distributions at from given plane by propagating many rays and collecting them at another plane. Rays is the base class that provides the essential mechanisms to obtain histograms on a list of rays (created or collected). This list of rays is a property of the base class. Subclasses are specific to a given ray distribution (Lambertian for instance) and will create each ray on demand, then store them as they go in the rays list.
It is an iterable object, which means it can be used in an expression like for ray in rays: which is convenient both when propagating rays or when analysing the resulting rays that reached a plane in ImagingPath, MatrixGroup or any tracing function.
- Parameters:
rays (list of ray) – the input rays to be defined as the list of rays
- iteration
When used as an iterator, this represents the current iteration. Reinitialized to zero everytime.
- Type:
int
- progressLog
How many iterations after which the progress through the iterator is shown (default=1000) This is mutliplied by 3 after progress report.
- Type:
int
- -yValues
An array of shape N*1 (N is the number of rays) which shows the height of each ray
- Type:
array
- -thetaValues
An array of shape N*1 (N is the number of rays) which shows the angle of each ray
- Type:
array
- -yHistogram
An array that shows the values in the histogram of the rays according to the height of rays
- Type:
array
- -thetaHistogram
An array that shows in the histogram of the rays’ angle
- Type:
array
- _directionBinEdges
Cached value of the direction
- Type:
struct
- _countHistogramParameters
Cached value of the histogram parameters.
- Type:
struct
- _xValuesCountHistogram
The x values for the histogram of rays’ height
- Type:
array
- _anglesHistogramParameters
The y values the histogram of rays’ angle
- Type:
array
- -xValuesAnglesHistogram
The x values for the histogram of rays’ angle
- Type:
array
- append(ray, copy=False)
A ray can be appended to the List of the rays using this function.
- Parameters:
ray (object of ray class) – a ray with height y and angle theta
- property count
Returns the number of rays in the list.
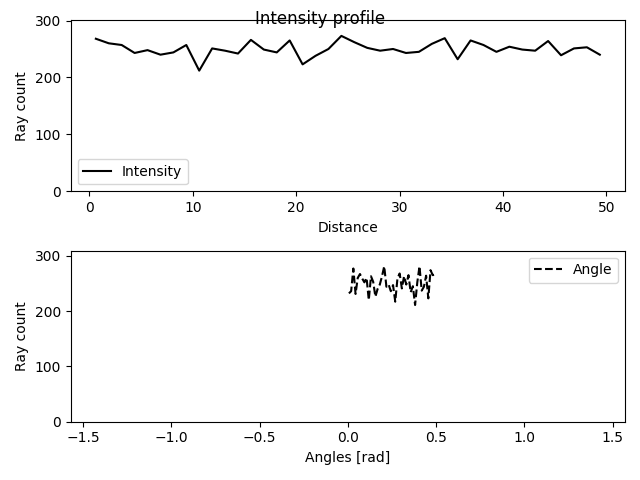
- display(title='Intensity profile', showTheta=True)
This function plots the intensity profiles of a list of rays.
- Parameters:
title (string) – the title for the plot (default=”Intensity profile”)
showTheta (bool) – If True, the values for the angle of rays will be shown. (default=True)
Examples
>>> from raytracing import *
>>> nRays = 10000 # Increase for better resolution
>>> minHeight=0
>>> maxHeight=50
>>> minTheta=0
>>> maxTheta=0.5
>>> nBin=20
>>> # define a list of random rays with uniform distribution
>>> inputRays = RandomUniformRays(yMin=minHeight, yMax=maxHeight, thetaMin=minTheta,thetaMax=maxTheta, maxCount=nRays)
>>> inputRays.display()
- displayProgress()
This function prints the progress of the iterations
- load(filePath, append=False)
A list of rays can be loaded using this function.
- Parameters:
filePath (str or PathLike or file-like object) – A path, or a Python file-like object, or possibly some backend-dependent object. Must be provided in OS-dependent format.
append (bool) – If True, the loaded rays will be appended to the current list of rays.
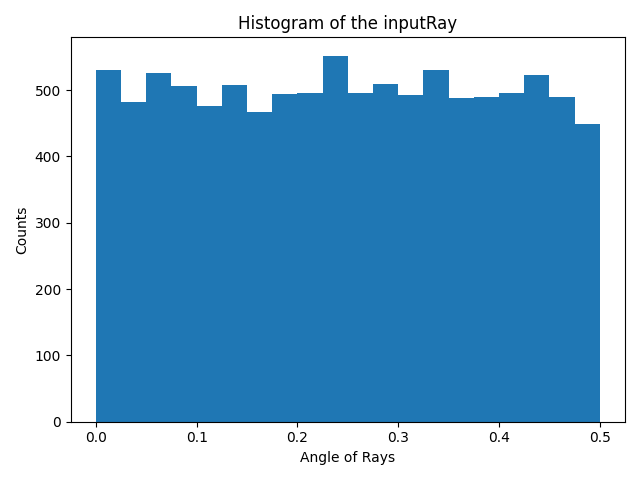
- rayAnglesHistogram(binCount=None, minValue=None, maxValue=None)
This functions calculates the histogram for the angle of the rays.
- Parameters:
binCount (int) – number of defined bins in the histogram. If it is not defined, the histogram will have 40 bins.
minValue (float) – The minimum value to be considered in the histogram. If it is not defined in the inputs, the minimum angle of rays will be assigned to this parameter.
maxValue (float) – The maximum value to be considered in the histogram. If it is not defined in the inputs, the maximum angle of rays will be assigned to this parameter.
- Returns:
_xValuesAnglesHistogram (array) – An array (Bins*1) that includes the x values for bins.
_thetaHistogram (array) – An array (Bins*1) that includes the y values for bins.
Examples
The function can be used to calculate the x values and y values for the histogram of an input ray.
>>> from raytracing import *
>>> nRays = 10000 # Increase for better resolution
>>> minHeight=0
>>> maxHeight=50
>>> minTheta=0
>>> maxTheta=0.5
>>> nBin=20
>>> # define a list of random rays with uniform distribution
>>> inputRays = RandomUniformRays(yMin=minHeight, yMax=maxHeight, thetaMin=minTheta,thetaMax=maxTheta, maxCount=nRays)
>>> [xVal,yVal]=inputRays.rayAnglesHistogram(binCount=nBin)
And to plot the hitogram we can use xVal and yVal of the theta as the following:
>>> import matplotlib.pyplot as plt
>>> _ = plt.figure()
>>> _ = plt.bar(xVal,yVal,width=maxTheta/nBin)
>>> _ = plt.title('Histogram of the inputRay')
>>> _ = plt.ylabel('Counts')
>>> _ = plt.xlabel('Angle of Rays')
>>> _ = plt.show()
See also
raytracing.rays.rayCountHistogram
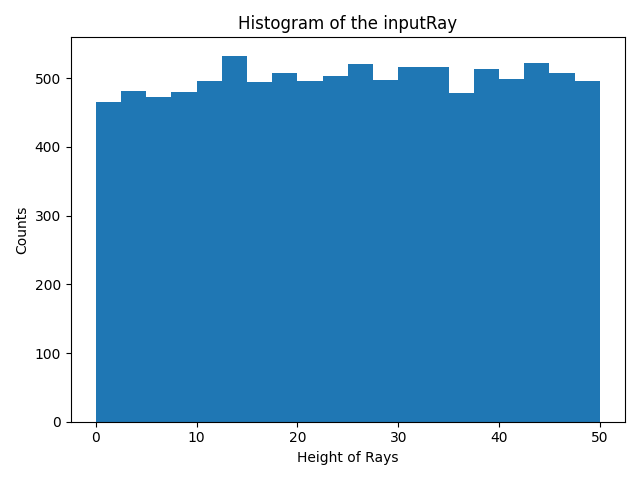
- rayCountHistogram(binCount=None, minValue=None, maxValue=None)
This functions calculates the histogram for the height of the rays.
- Parameters:
binCount (int) – number of defined bins in the histogram. If it is not defined, the histogram will have 40 bins.
minValue (float) – The minimum value to be considered in the histogram. If it is not defined in the inputs, the minimum height of rays will be assigned to this parameter.
maxValue (float) – The maximum value to be considered in the histogram. If it is not defined in the inputs, the maximum height of rays will be assigned to this parameter.
- Returns:
_xValuesCountHistogram (array) – An array (Bins*1) that includes the x values for bins.
_yHistogram (array) – An array (Bins*1) that includes the y values for bins.
Examples
The function can be used to calculate the x values and y values for the histogram of an input ray.
>>> from raytracing import *
>>> nRays = 10000 # Increase for better resolution
>>> minHeight=0
>>> maxHeight=50
>>> nBin=20
>>> inputRays = RandomUniformRays(yMin=minHeight,yMax=maxHeight, maxCount=nRays)
>>> [xVal,yVal]=inputRays.rayCountHistogram(binCount=nBin)
And to plot the hitogram we can use xVal and yVal as the following:
>>> import matplotlib.pyplot as plt
>>> _ = plt.figure()
>>> _ = plt.bar(xVal,yVal,width=maxHeight/nBin)
>>> _ = plt.title('Histogram of the inputRay')
>>> _ = plt.ylabel('Counts')
>>> _ = plt.xlabel('Height of Rays')
>>> _ = plt.show()
See also
raytracing.rays.rayAnglesHistogram
- save(filePath)
A list of rays can be saved using this function.
- Parameters:
filePath (str or PathLike or file-like object) – A path, or a Python file-like object, or possibly some backend-dependent object. Must be provided in OS-dependent format.
- property thetaValues
Returns the angles of rays in the list.
- property yValues
Returns the heights of rays in the list.
Methods
|
|
|
A ray can be appended to the List of the rays using this function. |
|
This function plots the intensity profiles of a list of rays. |
This function prints the progress of the iterations |
|
|
A list of rays can be loaded using this function. |
|
This functions calculates the histogram for the angle of the rays. |
|
This functions calculates the histogram for the height of the rays. |
|
A list of rays can be saved using this function. |
Inherited Methods
Attributes
Returns the number of rays in the list. |
|
|
|
Returns the angles of rays in the list. |
|
Returns the heights of rays in the list. |