LambertianRays
- class raytracing.LambertianRays(yMax=1.0, yMin=None, M=100, N=100, I=100)
Bases:
RaysA list of rays with Lambertian distribution.
- Parameters:
yMax (float) – Maximum height for the rays (default=1.0)
yMin (float) – Minimum height for the rays (default=None). If no value is assigned to this parameter it will be -yMax.
M (int) – Number of points that are defined for the height of rays
N (int) – Number of rays for each point
I (int) – Number of points that are defined for the angle of rays
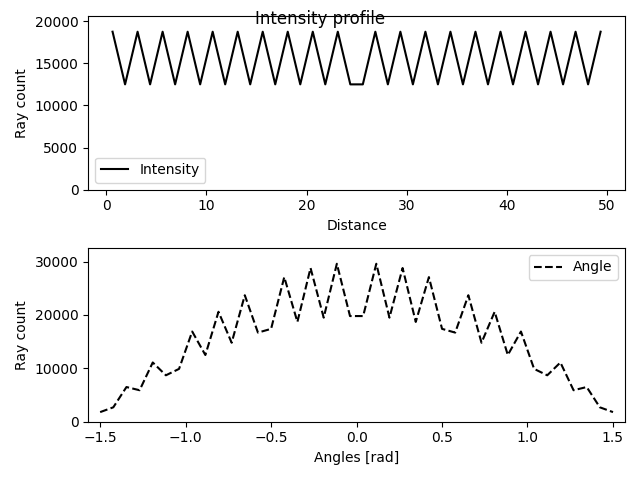
Examples
>>> from raytracing import *
>>> nRays = 1000 # Increase for better resolution
>>> minHeight=0
>>> maxHeight=50
>>> # define a list of rays with Lambertian distribution
>>> inputRays = LambertianRays(yMin=minHeight, yMax=maxHeight)
>>> inputRays.display()
Methods
|
Inherited Methods
|
A ray can be appended to the List of the rays using this function. |
|
This function plots the intensity profiles of a list of rays. |
|
This function prints the progress of the iterations |
|
A list of rays can be loaded using this function. |
|
This functions calculates the histogram for the angle of the rays. |
|
This functions calculates the histogram for the height of the rays. |
|
A list of rays can be saved using this function. |
Attributes
|
Returns the number of rays in the list. |
|
|
|
Returns the angles of rays in the list. |
|
Returns the heights of rays in the list. |