LambertianRays.display
- raytracing.LambertianRays.display(self, title='Intensity profile', showTheta=True)
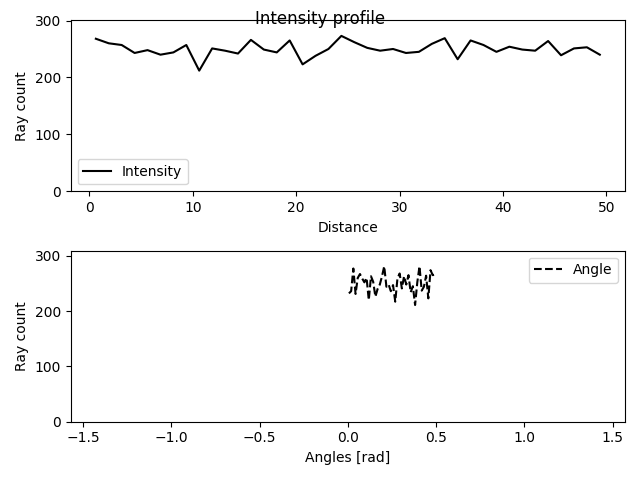
This function plots the intensity profiles of a list of rays.
- Parameters:
title (string) – the title for the plot (default=”Intensity profile”)
showTheta (bool) – If True, the values for the angle of rays will be shown. (default=True)
Examples
>>> from raytracing import *
>>> nRays = 10000 # Increase for better resolution
>>> minHeight=0
>>> maxHeight=50
>>> minTheta=0
>>> maxTheta=0.5
>>> nBin=20
>>> # define a list of random rays with uniform distribution
>>> inputRays = RandomUniformRays(yMin=minHeight, yMax=maxHeight, thetaMin=minTheta,thetaMax=maxTheta, maxCount=nRays)
>>> inputRays.display()