RandomLambertianRays.rayAnglesHistogram
- raytracing.RandomLambertianRays.rayAnglesHistogram(self, binCount=None, minValue=None, maxValue=None)
This functions calculates the histogram for the angle of the rays.
- Parameters:
binCount (int) – number of defined bins in the histogram. If it is not defined, the histogram will have 40 bins.
minValue (float) – The minimum value to be considered in the histogram. If it is not defined in the inputs, the minimum angle of rays will be assigned to this parameter.
maxValue (float) – The maximum value to be considered in the histogram. If it is not defined in the inputs, the maximum angle of rays will be assigned to this parameter.
- Returns:
_xValuesAnglesHistogram (array) – An array (Bins*1) that includes the x values for bins.
_thetaHistogram (array) – An array (Bins*1) that includes the y values for bins.
Examples
The function can be used to calculate the x values and y values for the histogram of an input ray.
>>> from raytracing import *
>>> nRays = 10000 # Increase for better resolution
>>> minHeight=0
>>> maxHeight=50
>>> minTheta=0
>>> maxTheta=0.5
>>> nBin=20
>>> # define a list of random rays with uniform distribution
>>> inputRays = RandomUniformRays(yMin=minHeight, yMax=maxHeight, thetaMin=minTheta,thetaMax=maxTheta, maxCount=nRays)
>>> [xVal,yVal]=inputRays.rayAnglesHistogram(binCount=nBin)
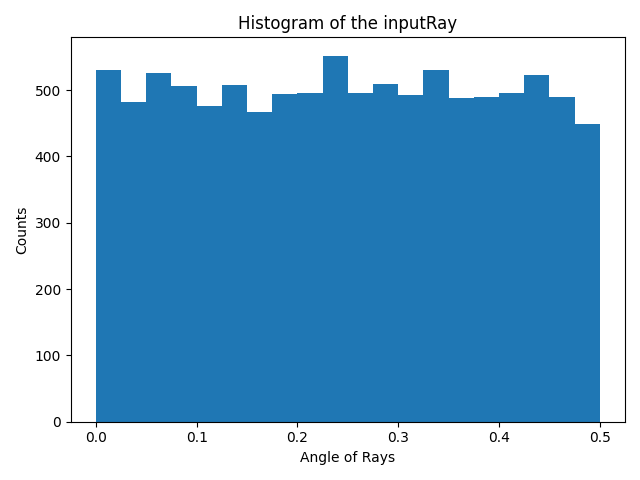
And to plot the hitogram we can use xVal and yVal of the theta as the following:
>>> import matplotlib.pyplot as plt
>>> _ = plt.figure()
>>> _ = plt.bar(xVal,yVal,width=maxTheta/nBin)
>>> _ = plt.title('Histogram of the inputRay')
>>> _ = plt.ylabel('Counts')
>>> _ = plt.xlabel('Angle of Rays')
>>> _ = plt.show()
See also
raytracing.rays.rayCountHistogram